Plot Time Series
This module can plot an arbitrary amount of time series data, to allow for live insights into acquired time series data.
Usage
This modules display window is also its configuration window. Multiple time-series plots can be shown in a row, and data can be fed in from an arbitrary amount of other modules via Integer or Float signal ports.
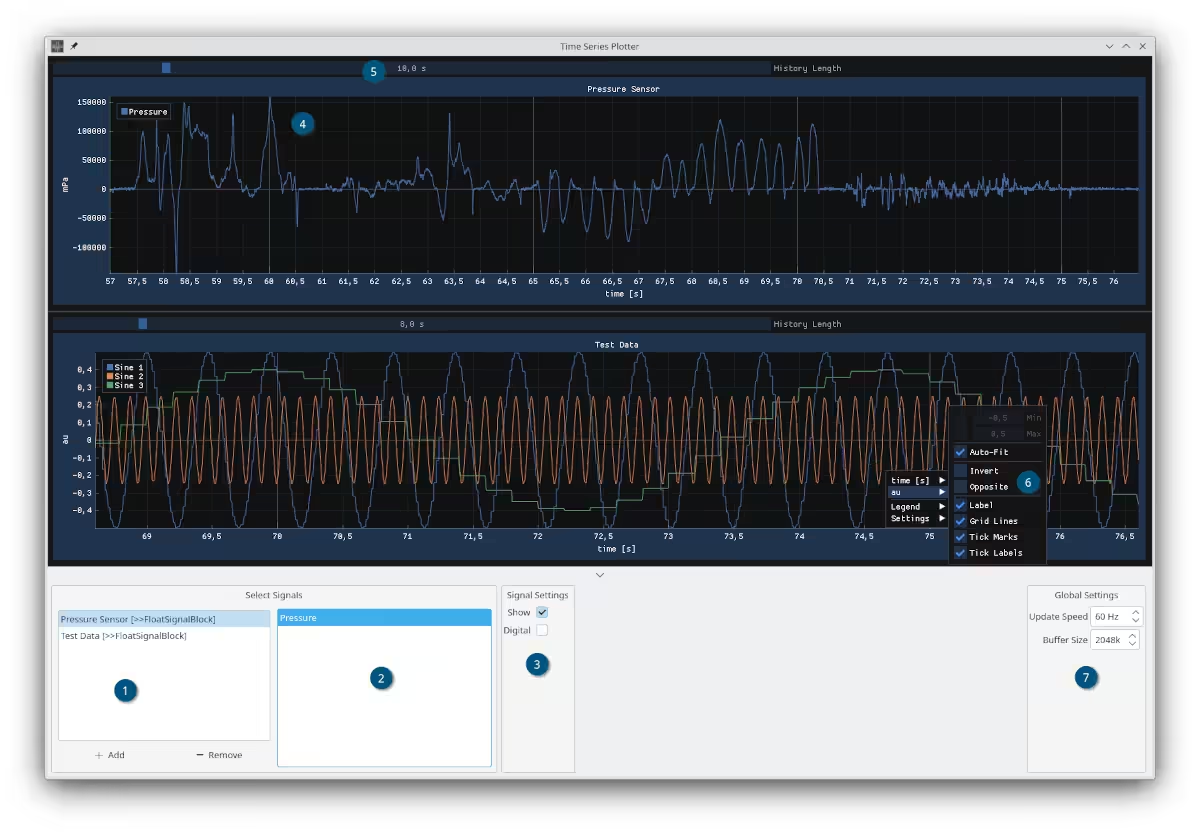
The plot display window, with the configuration panel opened.
- This box lists all available ports. You can add or remove them using the respective buttons, to make space for more plots or plot more things at once.
- Once the experiment has been run once, with the respective ports connected, the signals box is populated with the available signals.
- Signals can be shown or hidden and their type changed using the signal settings panel.
- During a run, the incoming data is ploted live.
- During a run, the amount of displayed data can be changed using this slider (up to a minute backlog can be displayed)
- By right-clicking on a plot window, individual display properties can be altered to have a closer look at the data.
- To improve runtime performance, the GUI update rate as well as the amount of data stored in memory for later viewing can be altered by the user.
Ports
| Name | Direction | Data Type | Description |
|---|---|---|---|
| 🠺[Float] | In | FloatSignalBlock | Float signal inputs |
| 🠺[Integer] | In | IntSignalBlock | Integer signal inputs |
Stream Metadata
No output streams are generated, but input streams must have time_unit, data_unit and signal_names set. If the time unit is index, sample_rate also has to be set on the incoming channel.