Latency Check
This module measures latencies between TTL pulses arriving on hardware signal lines and visualizes them as a live-updating histogram. It is useful for characterizing the timing behavior of an experimental setup, for example the delay between a stimulus trigger and a device response, or the jitter of a periodic signal.
For every completed measurement the module also emits an acknowledgement pulse on its Line Control output. By feeding that pulse back into the setup, round-trip latencies (Syntalos reaction time included) can be measured as well.
Usage
Connect a source of LineReading data — typically a Firmata I/O module — to the input port(s), and (optionally) route the Line Control output back to the device that should receive the acknowledgement pulse.
The module operates in one of two modes, selectable in its settings:
- Dual line (A → B): measures the latency between a pulse on Line A and the next pulse on Line B. A pulse on Line A arms the measurement; the following pulse on Line B completes it (latency = t(B) − t(A)), records the value and fires the acknowledgement pulse. Both inputs must be connected.
- Single line (interval on A): measures the interval between consecutive pulses on Line A. Each qualifying pulse records the time since the previous one and fires the acknowledgement pulse. Only Line A may be connected.
All latencies are derived from the timestamps embedded in the incoming LineReading messages, so the measurement is independent of Syntalos' own processing time.
Settings
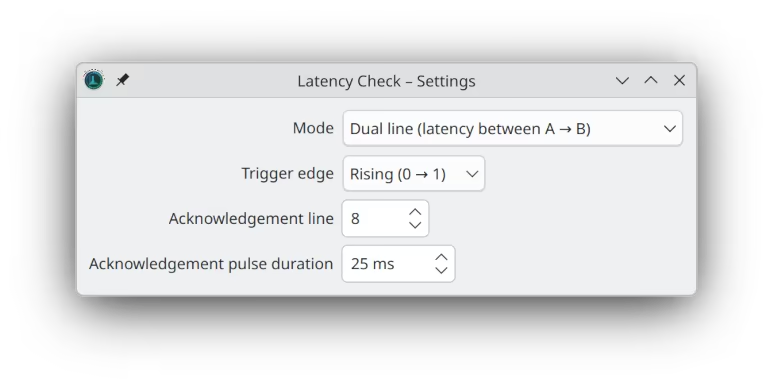
- Mode — Dual line or Single line (see above).
- Trigger edge — which line transition counts as a pulse: Rising (0 → 1, the default), Falling (1 → 0) or Both edges (any change).
- Acknowledgement line — the hardware line number on which the acknowledgement pulse is emitted. It is automatically configured as a digital output at the start of a run.
- Acknowledgement pulse duration — the length of the acknowledgement pulse, in milliseconds.
Display
The display window shows a live histogram of the measured latencies (in milliseconds). The number of histogram bins can be changed with the Bins slider, the recorded data can be reset with the Clear button, and a summary line reports the current count, last value, minimum, maximum, mean, median and standard deviation.
Ports
| Name | Direction | Data Type | Description |
|---|---|---|---|
| 🠺Line A | In | LineReading | Primary pulse input. Used in both modes. |
| 🠺Line B | In | LineReading | Second pulse input. Used (and required) only in dual-line mode. |
| Line Control🠺 | Out | LineCommand | Acknowledgement pulse emitted once a measurement completes (and the line-mode setup). |
| Latencies🠺 | Out | SignalBlockI32 | One sample per measurement, carrying the measured latency. Emitted regardless of whether the port is connected. |
Stream Metadata
The Latencies output stream sets the following metadata (see Common Stream Metadata):
- signal_names — ["Latency"]
- time_unit — microseconds (sample timestamps are the master-timer time of the completing pulse)
- data_unit — µs (the latency value itself is stored in microseconds)